Define clear objectives linked to your organisational mission to avoid distraction.
Key Takeaways
Measuring digital success helps cultural institutions move beyond guesswork to data-backed growth. These five principles provide a foundation for understanding your impact and improving your digital operations.
Define clear objectives linked to your organisational mission to avoid distraction.
Prioritise a few primary metrics rather than chasing every available data point.
Monitor technical health and accessibility to ensure all users can engage.
Standardise reporting cycles to turn raw data into actionable decision-making tools.
Balance quantitative analytics with qualitative user feedback for a complete perspective.
Defining clear digital objectives
Aligning digital goals with organisational mission
Before diving into spreadsheets, every cultural project needs a clear purpose that reflects the institution's broader goals. Digital initiatives should never exist in a silo; they must serve your mission, whether that involves local community outreach or promoting wider access to collections. When your digital strategy maps directly to your core values, it becomes much easier to identify which efforts actually drive the organisation forward.
Identifying primary and secondary KPIs
Many teams fall into the trap of collecting too much data without knowing how to use it. Focus on choosing one or two primary metrics that signal success, such as ticket revenue or newsletter sign-ups, and treat everything else as secondary. This helps prevent information overload, allowing staff to focus their limited time on the activities that make a measurable difference. Selecting art gallery KPIs that align with your specific growth needs ensures your team moves in a unified direction.
Stakeholder alignment for digital projects
Digital projects often fail because different departments have conflicting success definitions. You need to gather consensus on what matters most before starting a configuration or design sprint. Getting key stakeholders in a room early ensures that everyone understands the project constraints and shares a definition of what a successful outcome looks like.
Essential website and platform metrics
Analysing traffic sources and user behaviour
Understanding how people arrive at your digital presence is the first step in optimising your visitor journey. By auditing where traffic originates, you can determine if your promotional efforts are reaching the right communities or if your content is being discovered organically through search engines. Examining website analytics helps pinpoint bottlenecks where potential visitors drop off before completing an action, such as an exhibition inquiry or a calendar review.
Monitoring dwell time and content engagement
High traffic volume doesn't always indicate high value. Deep engagement, measured through dwell time and reader interaction, often provides a more honest view of how well your content connects with an audience. If users spend significant time on your site, they are likely finding the information they need to engage further with your physical or virtual gallery spaces.
Assessing technical performance and accessibility
If a platform is slow or difficult to navigate, users will leave regardless of how compelling the art might be. Technical performance, including load speeds and WCAG 2.1 AA compliance, directly impacts how effectively you reach a diverse audience. Ensuring your site runs smoothly is a non-negotiable part of modern arts organisation digital metrics that keeps the door open to all potential visitors.
Measuring digital audience engagement
Evaluating social media interaction rates
Social platforms offer a space to start conversations rather than just pushing out static announcements. Instead of focusing solely on follower counts, look at shares, comments, and saves as evidence of authentic community building. These interactions signal that your content is resonating enough to prompt someone to participate in the conversation.
Tracking newsletter and email performance
Email remains one of the most reliable ways to sustain long-term engagement with your members and local visitors. Open rates and click-through metrics can tell you exactly which exhibitions or upcoming events have generated genuine interest among your subscribers. This helps ensure that your communication strategy remains relevant to the people who care most about your organisation's work.
Analysing digital exhibition and event attendance
Measuring the success of virtual programming requires looking beyond simple login counts. By tracking how long participants stay in a digital event or if they download supporting materials, you can gauge the depth of their interest. Many institutions now use digital metrics dashboards to aggregate this information, making it easier to track projects across multiple platforms over time.
Tracking conversions and revenue growth
Optimising online ticket booking paths
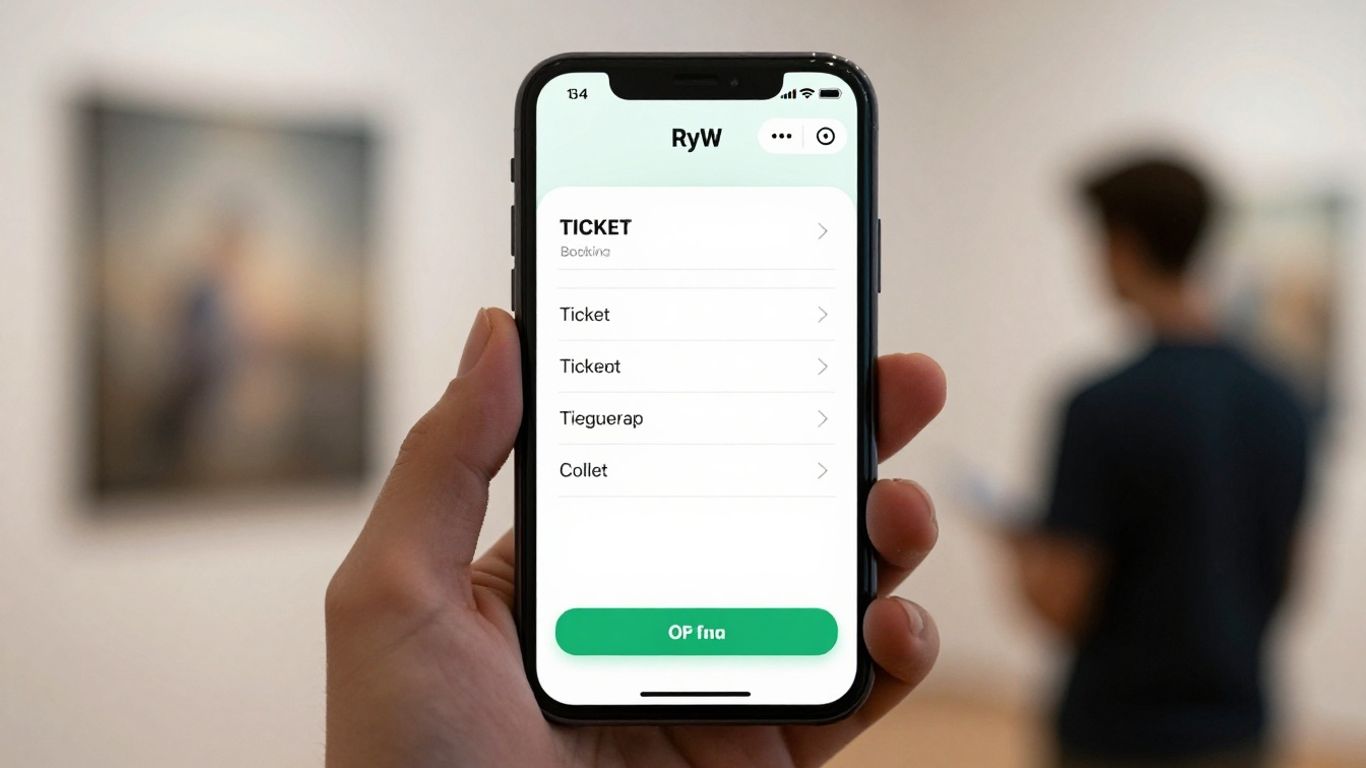
Streamlining the user journey is essential for turning interest into ticket sales or event registrations. Even small friction points in a booking process can prevent a visitor from finishing their purchase. Consider the following common ways to identify and resolve these issues:
Audit the number of clicks required from a homepage to a ticket confirmation.
Track conversion rates by segment to identify which traffic sources are most effective.
Use heatmaps to see if users are getting stuck on the final payment screen.
Conduct basic user testing to identify common hurdles in your booking flow.
This simple refinement process often yields higher conversion rates without needing to increase your total visitor count. Noran Design focuses on building these types of systems because we believe that digital infrastructure should serve as a solid foundation for growth rather than a source of operational frustration.
Evaluating digital donation campaigns
Digital donations offer another window into how highly your community values your institution. By tracking the performance of your online giving pages, you can determine which appeals or project-focused initiatives generate the strongest response. It is often about identifying patterns, such as whether a donor prefers supporting education initiatives versus building maintenance or large acquisitions.
Measuring membership sign-ups via digital channels
Membership drives are the bedrock of financial stability for many galleries, yet they are often poorly integrated with digital marketing. When you link your CRM to your web traffic, you can see exactly which digital touchpoints lead to a new member signing up. Aligning this data allows Noran Design to help you understand the full life cycle of an online visitor who eventually converts into a supporter.
Industry benchmarking and context
Comparing performance against arts industry standards
Context is everything when reviewing internal metrics. Industry-wide reports, such as the Arts Industry Benchmark Study, provide essential comparisons that help you determine if your performance is genuinely lagging or simply reflecting wider sector trends. Using these benchmarks provides a sanity check for your strategy.
Interpreting data within the cultural sector context
Data in the arts should be interpreted with the specific nuances of a cultural environment in mind. Unlike commercial e-commerce, cultural goals often include public benefit, representation, and long-term research which may not result in immediate revenue. It is vital to weight your performance metrics accordingly, ensuring that you do not force a commercial logic where it doesn't belong.
Balancing qualitative feedback with quantitative data
Numbers tell you what is happening, but rarely why. Combining your analytics dashboard with qualitative survey results provides a richer, more accurate view of how visitors feel during their experience. For instance, a drop in traffic might look like an issue, but survey data could reveal a planned shift in programming that was well-received by your core audience.
Effective digital strategies do not rely on static traffic counts. By integrating qualitative sentiment with your quantitative performance indicators, you build a resilient foundation for future growth that evolves alongside your audience.
This combination of data types allows for more refined adjustments, helping the team iterate on content and strategy with confidence.
Reporting and continuous improvement
Visualising data for non-technical stakeholders
If your reporting is buried in complex spreadsheets, your team might miss crucial opportunities to adjust their work. Creating simple, accessible visual summaries helps everyone from finance to curatorial teams grasp the current progress of digital projects. We often suggest implementing scalable design systems, which allow you to maintain, update, and present this information clearly without requiring constant manual adjustment.
Establishing regular reporting cycles
Consistency in reporting is just as important as the metrics themselves. Setting up a monthly or quarterly review cycle forces the team to reflect on past performance and make necessary pivots in real-time. Maintaining these habits builds a culture of continuous learning that keeps your digital operations sharp and competitive.
Using data insights to iterate content strategy
Every piece of content you produce is a data point waiting to be analysed. By reviewing which digital exhibits or articles generate the most engagement, you can refine your production pipeline to focus on what works best for your audience. This iterative cycle prevents the waste associated with producing content that does not align with your visitors' interests, ensuring your digital efforts remain lean and effective.
Conclusion
Measurement is not about collecting infinite data; it is about finding the signal in the noise to better serve your community. By focusing on mission-aligned KPIs, maintaining a commitment to technical accessibility, and continuously iterating based on what you learn, your organisation can build a sustainable digital presence that grows in value over time. Treat your metrics as a guide for decision-making rather than a scorecard, and you will find that your digital efforts support both your immediate goals and your long-term cultural mission.
Frequently Asked Questions
Why should an arts organisation care about digital metrics?
Digital metrics provide the evidence needed to understand how your audience interacts with your work, allowing you to move away from guesswork and towards strategic decision-making that supports your institution's core mission.
How many different metrics should I keep track of?
It is better to choose a small set of primary KPIs that align with your current goals rather than overwhelming your team with dozens of data points that do not directly feed into your strategy.
What are some common mistakes when setting digital goals?
One common error is failing to align digital objectives with the organisation's overall mission, or neglecting to ensure that stakeholders across different departments agree on what success looks like at the start of a project.
How can I make reports easier for my team to understand?
Focus on visualising data trends using simple charts or dashboards, and ensure that every report concludes with a clear list of what the data suggests doing next so that people can act on the findings.
When is the best time to review my digital performance metrics?
Establishing a regular, predictable reporting cycle—such as a monthly or quarterly meeting—is more effective than random check-ins, as it allows your team to develop a habit of monitoring progress and making iterative changes.
How should I balance qualitative feedback with quantitative data?
Use quantitative data from your analytics to identify what is occurring, and rely on qualitative feedback from visitor surveys or interviews to help explain the why behind those trends.
Can limited resources still support data tracking?
Yes, by focusing on a few essential metrics that matter most to your current growth, even small teams with limited budgets can generate useful insights to drive improvement without needing highly technical or expensive systems.